Stream Monitoring Map
Graphic Design
Interactive
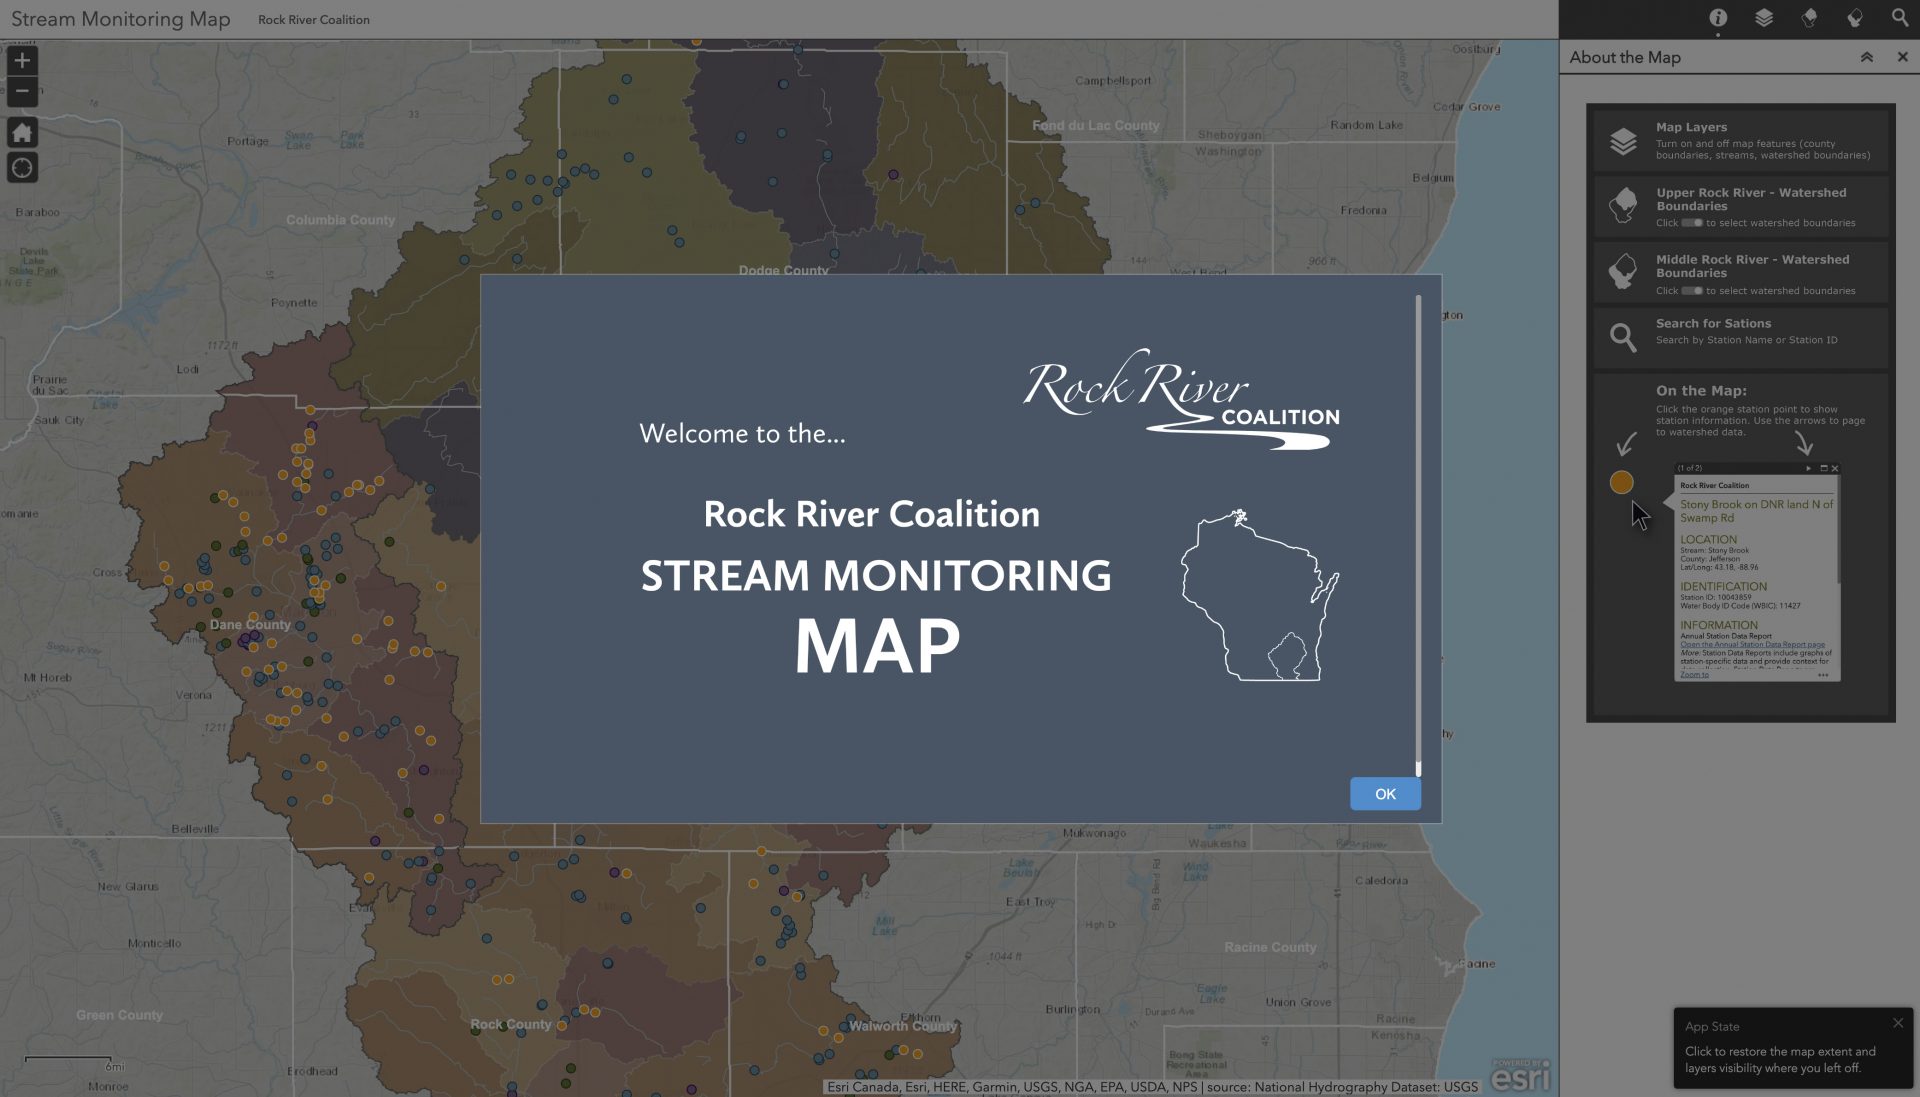
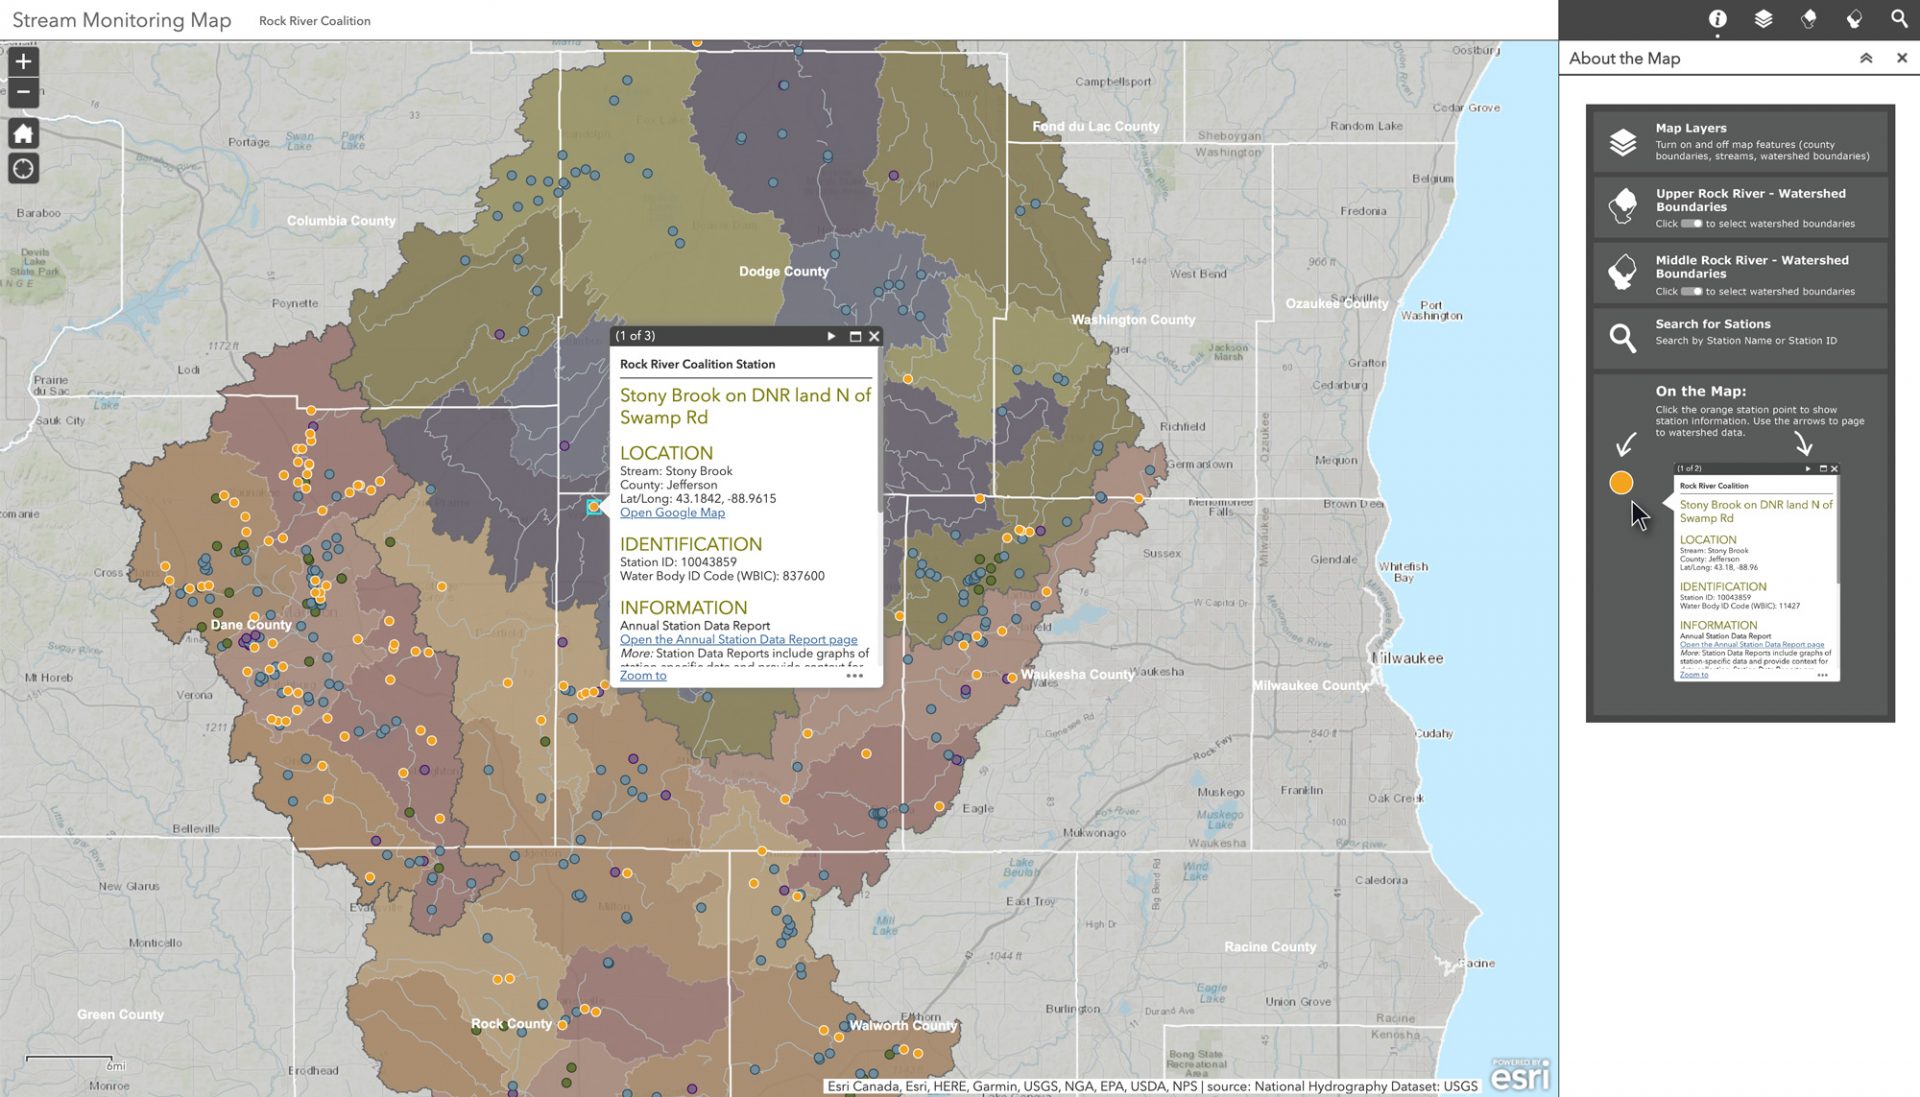
Stream Monitoring Map
Rock River Coalition helps to facilitate stream monitoring at over 60 different site locations. This interactive map shows each site location and directly links multiple sources of related information about them. Database constructed by Eric Compass. Structural design by Brooke Weiland Studios.
Task
My task was to understand the resources (data, plans, reports) connected to each stream monitoring site and how to reference them. I built and maintained the excel sheet of stream monitoring sites that functioned as a reference variable for the database. I designed the layers and interactivity in ESRI Story Maps.
-
Date
September 18, 2020
-
Skills
ESRI Story Maps, Mircosoft Excel
-
Client
Rock River Coalition
-
Tags
#DataVisualization #Interactive
Share project
Open Website